

For finance leaders at B2B SaaS companies, the metrics you track shape every decision from board reporting to resource allocation. This guide breaks down the 11 revenue metrics that matter most, explains how to calculate them accurately, and shows how clean contract data flowing through your billing systems turns these numbers into actionable intelligence.
What are SaaS revenue metrics?
SaaS revenue metrics are the financial indicators that measure recurring revenue health, customer retention, and unit economics. These numbers differ from traditional accounting measures because they reflect the unique cash flow patterns of subscription businesses—where revenue arrives over time, sometimes unpredictably based on usage, rather than in one-time transactions.
Traditional accounting looks backward at what happened. SaaS revenue metrics look forward at what will happen. This distinction matters because your board, investors, and leadership team need visibility into future cash flows—not just last quarter's performance.
- Traditional metrics: Focus on point-in-time snapshots like quarterly revenue and profit margins
- SaaS revenue metrics: Focus on forward-looking indicators like recurring revenue trends, retention rates, and expansion signals
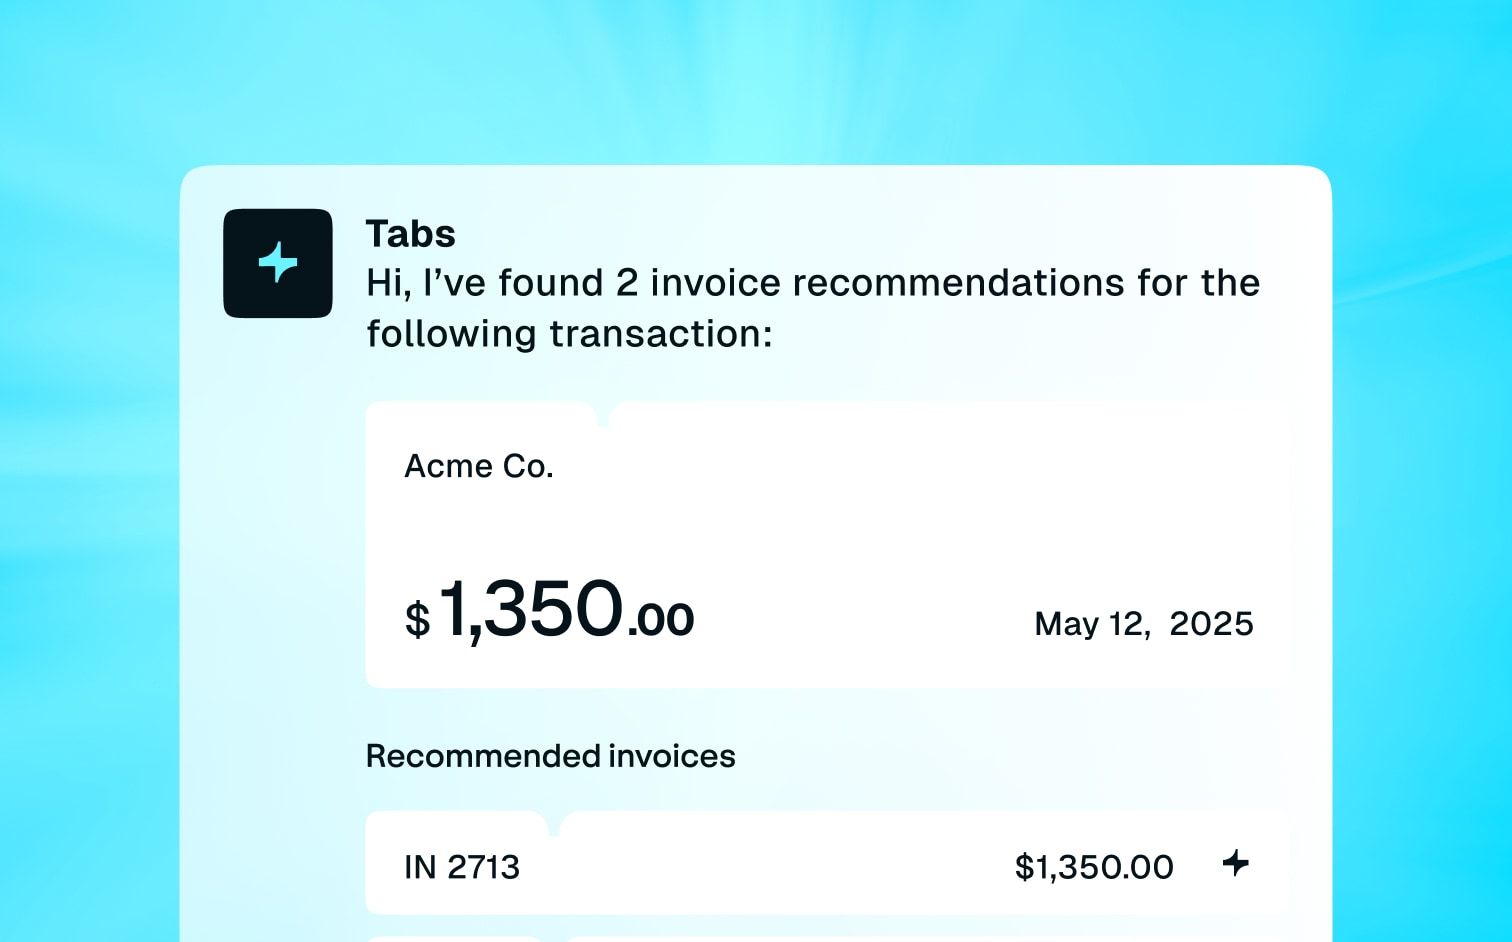
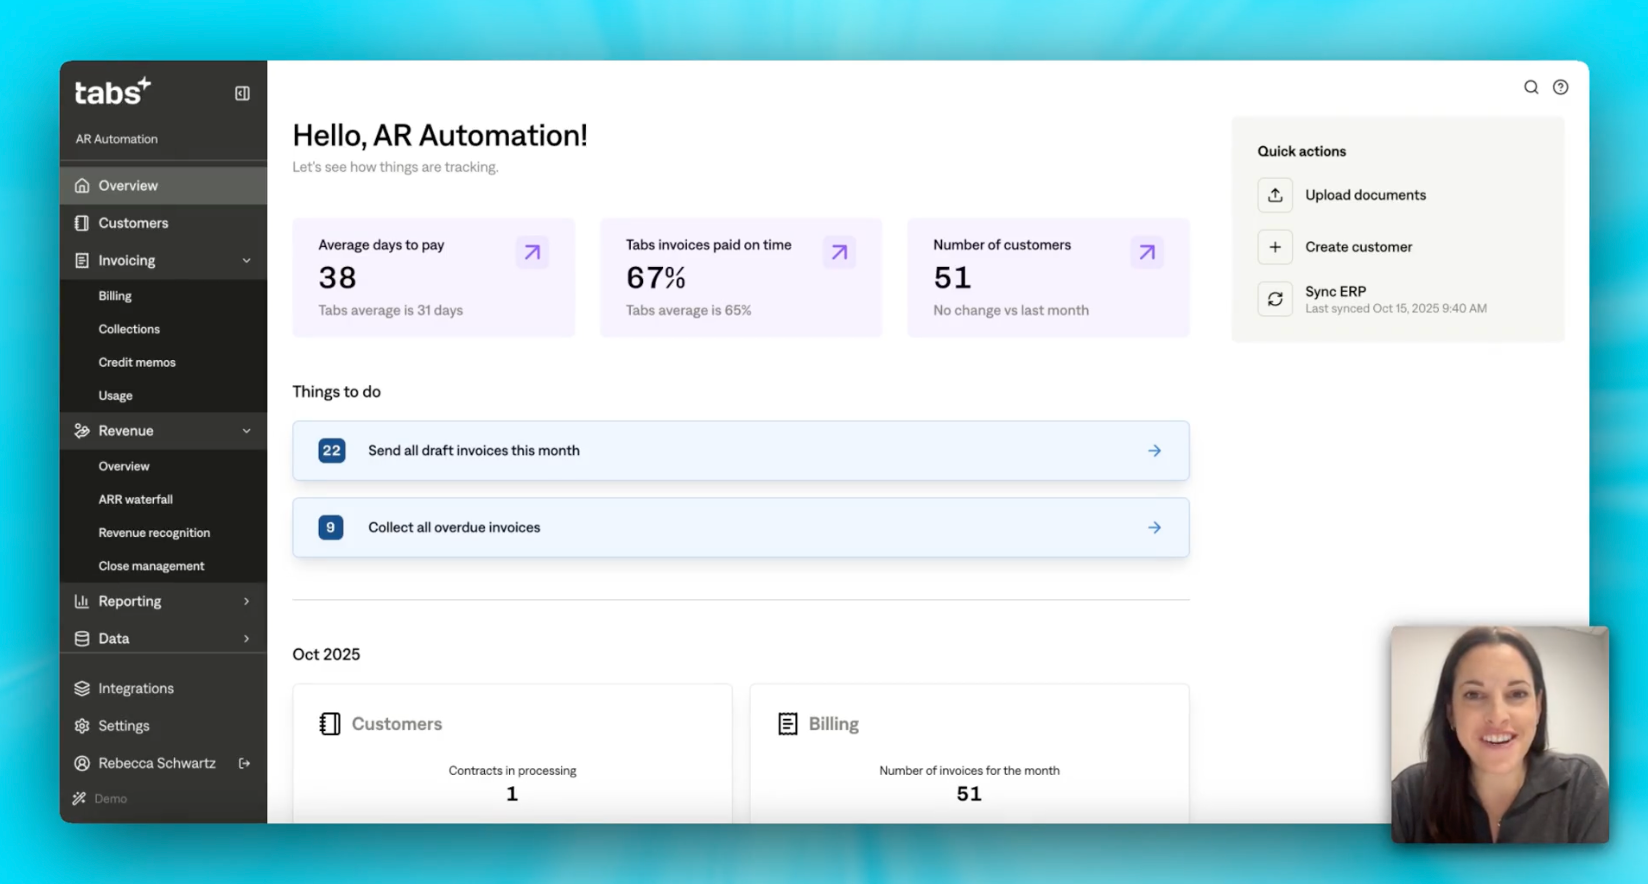
Tracking these metrics accurately requires clean contract data flowing into your billing systems. Tabs is a revenue automation platform that sits downstream of your CRM and CPQ. It uses AI to operationalize signed contracts, extracting key terms and translating them into billing workflows, invoicing, and revenue schedules. This commercial context—capturing not just what the contract says, but the billing and revenue recognition implications—helps ensure your metrics reflect contractual reality rather than spreadsheet estimates.
Core SaaS revenue metrics to track
These seven metrics form the foundation of what SaaS financial reporting tools track. Every other calculation builds on them. Getting them wrong cascades errors through your entire finance operation.
The challenge? Most finance teams piece together data from CRMs, spreadsheets, and billing tools that don't communicate. Tabs sits downstream of your CRM and CPQ to operationalize signed contracts automatically—extracting terms, generating invoices, and creating revenue schedules so you can report without constant manual re-entry.
1. Annual Recurring Revenue (ARR) as your growth baseline
Annual Recurring Revenue is the annualized value of all active subscription contracts. This means if you have 100 customers each paying $1,000 per month, your ARR is $1.2 million. ARR serves as the primary valuation metric for SaaS businesses.
To calculate ARR, exclude one-time fees, professional services, and variable usage charges unless they're contractually committed. Many finance teams accidentally inflate ARR by including revenue that isn't truly recurring. Tabs automatically extracts committed revenue from signed agreements to ensure your numbers reflect actual contractual obligations.
Why it matters: ARR is the number investors, board members, and acquirers use to value your company.
2. Monthly Recurring Revenue (MRR) as your trend line
Monthly Recurring Revenue is the normalized monthly value of your contracted recurring revenue. MRR provides more granular visibility into revenue momentum than ARR alone. You can spot problems—or wins—weeks earlier.
Track four distinct components:
- New MRR: Revenue from first-time customers
- Expansion MRR: Additional revenue from existing customers
- Contraction MRR: Reduced revenue from downgrades
- Churned MRR: Lost revenue from cancellations
Understanding this mix tells you whether growth comes from new logos or existing account expansion.
Why it matters: MRR movement categories reveal the health of your growth engine before ARR shows the full picture.
3. Net Revenue Retention (NRR) as your expansion signal
Net Revenue Retention is the percentage of revenue retained from existing customers over a period, including upgrades and excluding churned revenue. An NRR of 110% means you're growing revenue from your existing customer base by 10% annually—even without acquiring new customers.
NRR above 100% proves your product delivers ongoing value. Below 100% means you're fighting a leaky bucket. Calculating NRR accurately requires tracking expansion and contraction at the individual contract level. Tabs unifies this data into a system of intelligence for each customer, making NRR reporting faster, more consistent, and easier to audit.
Why it matters: NRR is the single best indicator of product-market fit and long-term revenue sustainability.
4. Expansion revenue and account growth
Expansion revenue is additional money generated from existing customers through upsells, cross-sells, or usage increases. This revenue carries higher margins than new customer acquisition because it doesn't require the same sales and marketing investment.
Track expansion by source to understand which growth levers work:
- Price increases on renewals
- Seat additions as teams grow
- Product upgrades to higher tiers
- Usage growth in usage-based pricing models—which Gartner predicts will capture 40% of enterprise SaaS spend by 2030
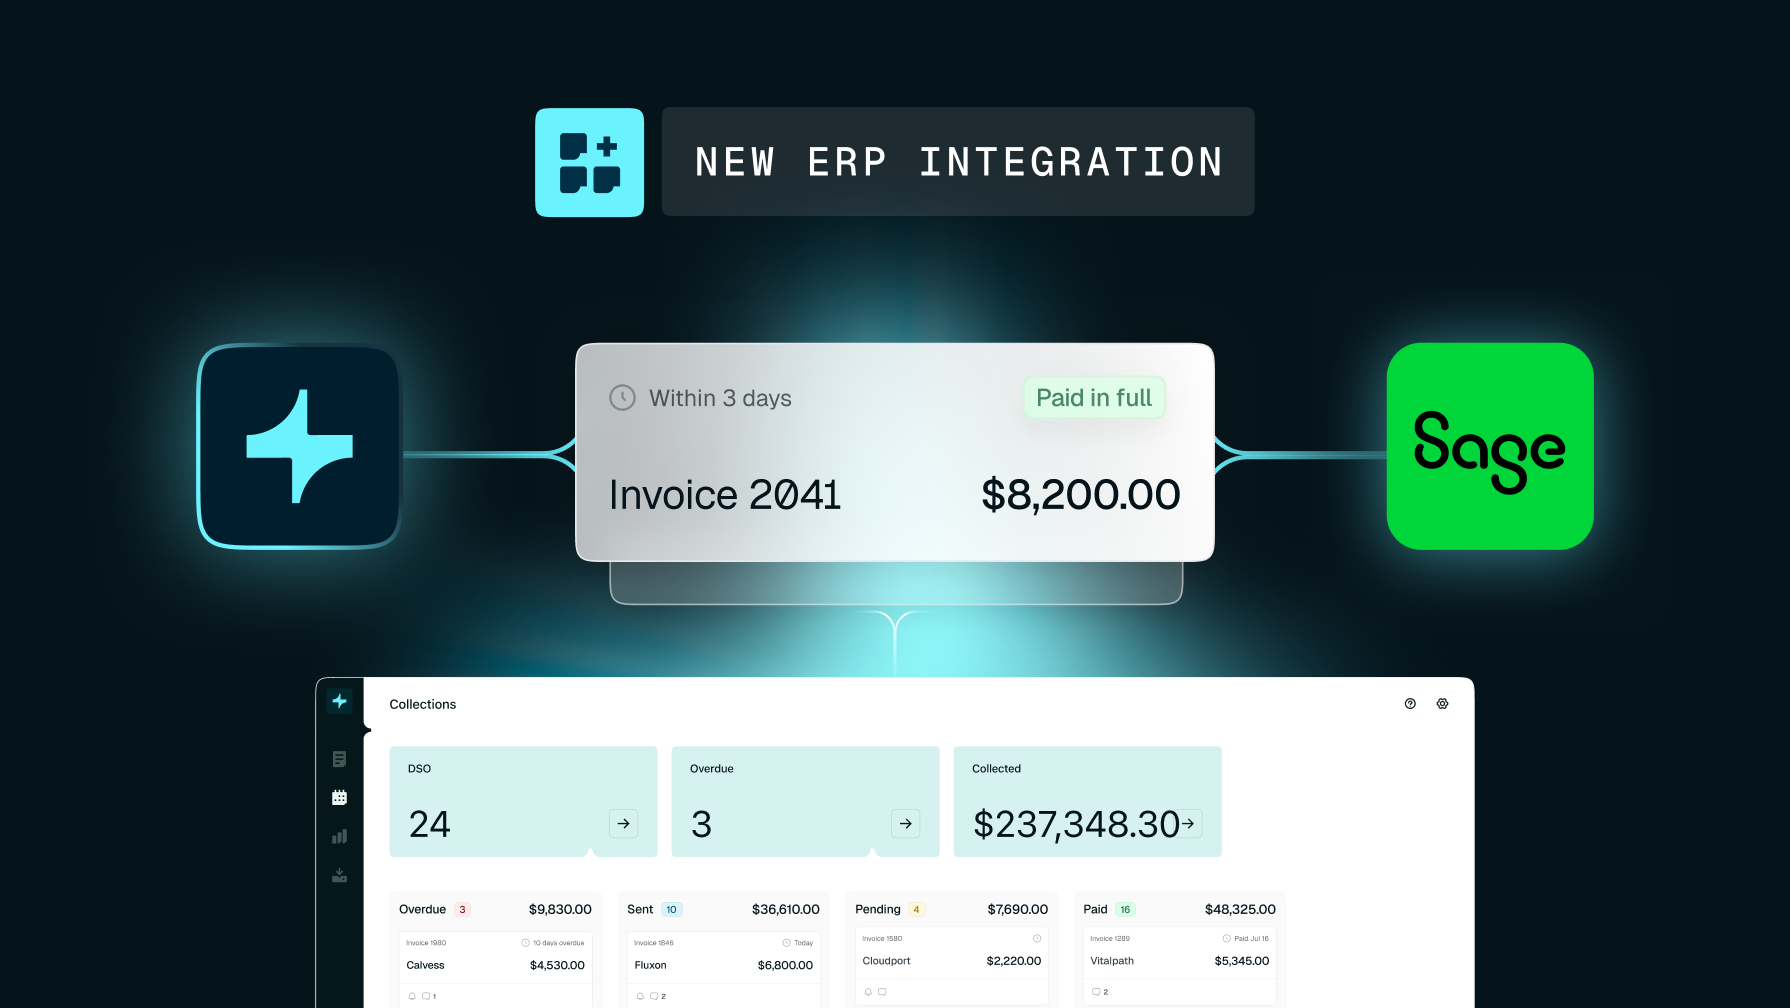
Tabs natively supports hybrid billing models—combining subscriptions witusage overages, product-led growth (PLG), and sales-led growth (SLG)—without requiring custom engineering work.
Why it matters: Expansion revenue is the fastest path to profitability for B2B SaaS companies.
5. Average Revenue Per Account (ARPA) and mix shift
Average Revenue Per Account is your total recurring revenue divided by the number of active accounts. ARPA trends reveal whether your business is moving upmarket or downmarket over time.
A rising ARPA usually indicates success landing larger enterprise deals. A falling ARPA might signal you're attracting smaller customers—which isn't necessarily bad, but changes your unit economics. Segment ARPA by customer cohort, contract type, or product line for actionable insights.
Why it matters: Blended averages hide problems in specific customer segments.
6. Revenue churn rate and contraction risk
Revenue churn is the percentage of recurring revenue lost from existing customers in a given period. Distinguish between gross revenue churn (total lost revenue) and net revenue churn (lost revenue minus expansion).
Revenue churn often matters more than logo churn. Losing one enterprise customer paying $500,000 annually hurts more than losing 50 customers paying $1,000 each. Early warning signals—like declining usage or missed payments—can predict churn before it happens. Tabs flags overdue balances early and helps you prioritize follow-up based on invoice terms and payment history, so you can intervene before churn shows up in your metrics.
Why it matters: High churn forces your sales team to work twice as hard just to maintain flat growth.
7. Annual Contract Value (ACV) and deal quality
Annual Contract Value is the average annualized revenue per individual contract. Unlike ARR, which measures the whole business, ACV measures the size of deals your sales team closes.
Track ACV alongside sales cycle length to quantify sales efficiency at different price points. A $100,000 ACV deal that takes nine months to close might be less efficient than a $30,000 deal that closes in six weeks.
Why it matters: ACV trends help finance teams evaluate whether pricing changes and sales motions are working.
Automate contract-to-cash. See your metrics clearly.
8. Customer Acquisition Cost (CAC) payback period and cash recovery
Customer Acquisition Cost payback period is the number of months required to recover what you spend to acquire a new customer. Shorter payback means you can reinvest cash into growth faster. A long payback creates a cash flow trough that requires constant funding to survive.
Calculate CAC payback using gross margin rather than raw revenue to reflect true cash recovery. Payback periods vary by go-to-market motion—PLG typically pays back faster than enterprise sales.
Why it matters: Scaling a broken acquisition model just accelerates your path to running out of cash.
9. Lifetime Value (LTV) and return threshold
Lifetime Value is the total gross profit you expect from a customer over the full relationship. The standard calculation: ARPA multiplied by gross margin, divided by revenue churn rate.
LTV projections are only as reliable as your churn assumptions. Segment LTV by acquisition channel or customer profile to understand which customers are most valuable. This data tells marketing exactly where to focus spend.
Why it matters: LTV sets the ceiling on what you can afford to spend acquiring customers.
10. LTV to CAC ratio as your investment guardrail
The LTV:CAC ratio compares customer lifetime value to acquisition cost. A ratio below 1:1 means you lose money on every customer acquired. Most successful B2B SaaS companies maintain a ratio of at least 3:1.
Evaluate this ratio alongside CAC payback. A high ratio with a long payback still creates cash flow challenges. You might eventually make money on each customer, but you'll run out of cash waiting.
Why it matters: This ratio indicates whether your customer acquisition spending is financially sustainable.
11. Gross margin as your profitability floor
Gross margin is revenue minus cost of goods sold (COGS), expressed as a percentage. For SaaS, COGS includes hosting, infrastructure, customer support, and professional services delivery.
Gross margin sets the ceiling on how much you can spend on sales, marketing, and R&D while remaining profitable. Investors expect SaaS gross margins above 70%. Below that threshold, you likely have an infrastructure efficiency problem or a pricing issue.
Why it matters: High gross margins are the primary reason software companies command premium valuations.
How finance teams improve SaaS revenue metrics
Tracking SaaS revenue metrics without the ability to influence them creates frustration.
TL;DR: Clean contract terms → accurate invoices, collections signals, and revenue schedules → metrics you can actually act on.
You need operational levers to actually improve these numbers. Finance must evolve from a reactive reporting function into a strategic driver of business growth.
Improvement requires clean data, automated workflows, and real-time visibility. Tabs provides the infrastructure that makes improvement possible by automating the contract-to-cash process and delivering the commercial context needed to identify issues before they impact your metrics.
- To improve NRR: Identify expansion opportunities through usage patterns, automate renewal reminders, flag at-risk accounts early
- To reduce churn: Monitor payment failures, automate dunning sequences, track engagement signals
- To accelerate CAC payback: Shorten time-to-invoice, reduce billing errors, improve collections velocity
When you automate these workflows, results follow. With Tabs, Statsig reduced aged receivables to near zero and handled a threefold increase in invoice volume without adding finance headcount. Meanwhile, Cortex reduced overdue invoices by 50%.
Revenue Recognition automation helps support ASC 606 compliance with audit-ready revenue schedules and controls. Tabs reduces the risk of manual errors in complex deferred revenue calculations.
Frequently asked questions
Which SaaS revenue metrics should a finance team automate first?
Start with ARR and MRR calculations because they feed into nearly every other metric, then automate collections tracking because it directly impacts cash flow. Automating these foundational numbers eliminates the manual reconciliation work that typically delays month-end close.
What CAC payback period should B2B SaaS companies target?
Most B2B SaaS companies target payback under 12 months, though Benchmarkit data shows the median reached 18 months in 2024. Enterprise sales motions often run 12–18 months due to higher contract values and longer implementation times. Companies with exceptionally high retention rates can sometimes justify longer payback periods.
How often should finance teams recalculate NRR?
Finance typically calculates NRR monthly for internal tracking and reports it quarterly to the board. RevOps usually owns the underlying data quality that makes accurate reporting possible. Rolling monthly calculations help leadership spot contraction trends before they derail quarterly targets.
Turn contract data into reliable revenue metrics—get a demo.