
Essential SaaS revenue metrics for subscription and usage-based models
For finance leaders at B2B companies managing subscription, usage-based, or hybrid pricing models, tracking revenue metrics accurately requires more than definitions. It requires systems that connect contract terms to billing, collections, and Revenue Recognition in real time. This guide breaks down the essential SaaS metrics every modern finance team needs to master, and shows how revenue automation eliminates the manual reconciliation that keeps you from acting on them.
What are SaaS revenue metrics?
SaaS revenue metrics are the financial measurements that tell you whether your recurring revenue business is healthy. And if your pricing is subscription + usage-based pricing, you need a revenue automation platform like Tabs that operationalizes signed contracts with commercial context—so MRR, ARR, churn, and Revenue Recognition stay consistent across CRM, billing, and ERP. Unlike traditional businesses where you sell something once and move on, the SaaS business model depends on customers paying you month after month. That fundamental difference requires a completely different way of measuring success.
These metrics answer three questions every finance leader needs to answer:
- Revenue predictability: How much recurring revenue can you count on next month?
- Growth efficiency: How much does it cost to acquire each dollar of new revenue?
- Customer value: How much is each customer worth over their entire relationship with you?
The challenge is that modern B2B companies rarely use simple pricing anymore. Gartner predicts 40% of enterprise SaaS spend will shift to usage-based models by 2030. You might have subscription fees, seat-based pricing, usage-based charges, and milestone payments all in the same contract. Tracking key SaaS metrics accurately requires systems that can model this complexity—not just what was billed, but how specific contract terms changed billing and Revenue Recognition.
Growth and economic metrics
Growth metrics tell you if your business model actually works. They reveal whether you're building something sustainable or just burning cash to create the illusion of progress.
Monthly recurring revenue (MRR)
MRR is the total predictable revenue you generate from subscriptions each month. You calculate it by adding up the monthly value of every active contract, excluding one-time fees like implementation or professional services.
But MRR isn't just one number. It breaks down into components that tell a richer story: New MRR from first-time customers, Expansion MRR from upsells, Contraction MRR from downgrades, and Churned MRR from cancellations. For usage-based models, you'll need to average variable consumption to get a meaningful monthly figure.
Why it matters: MRR is your operational heartbeat—the number you watch to know if this month is better than last month.
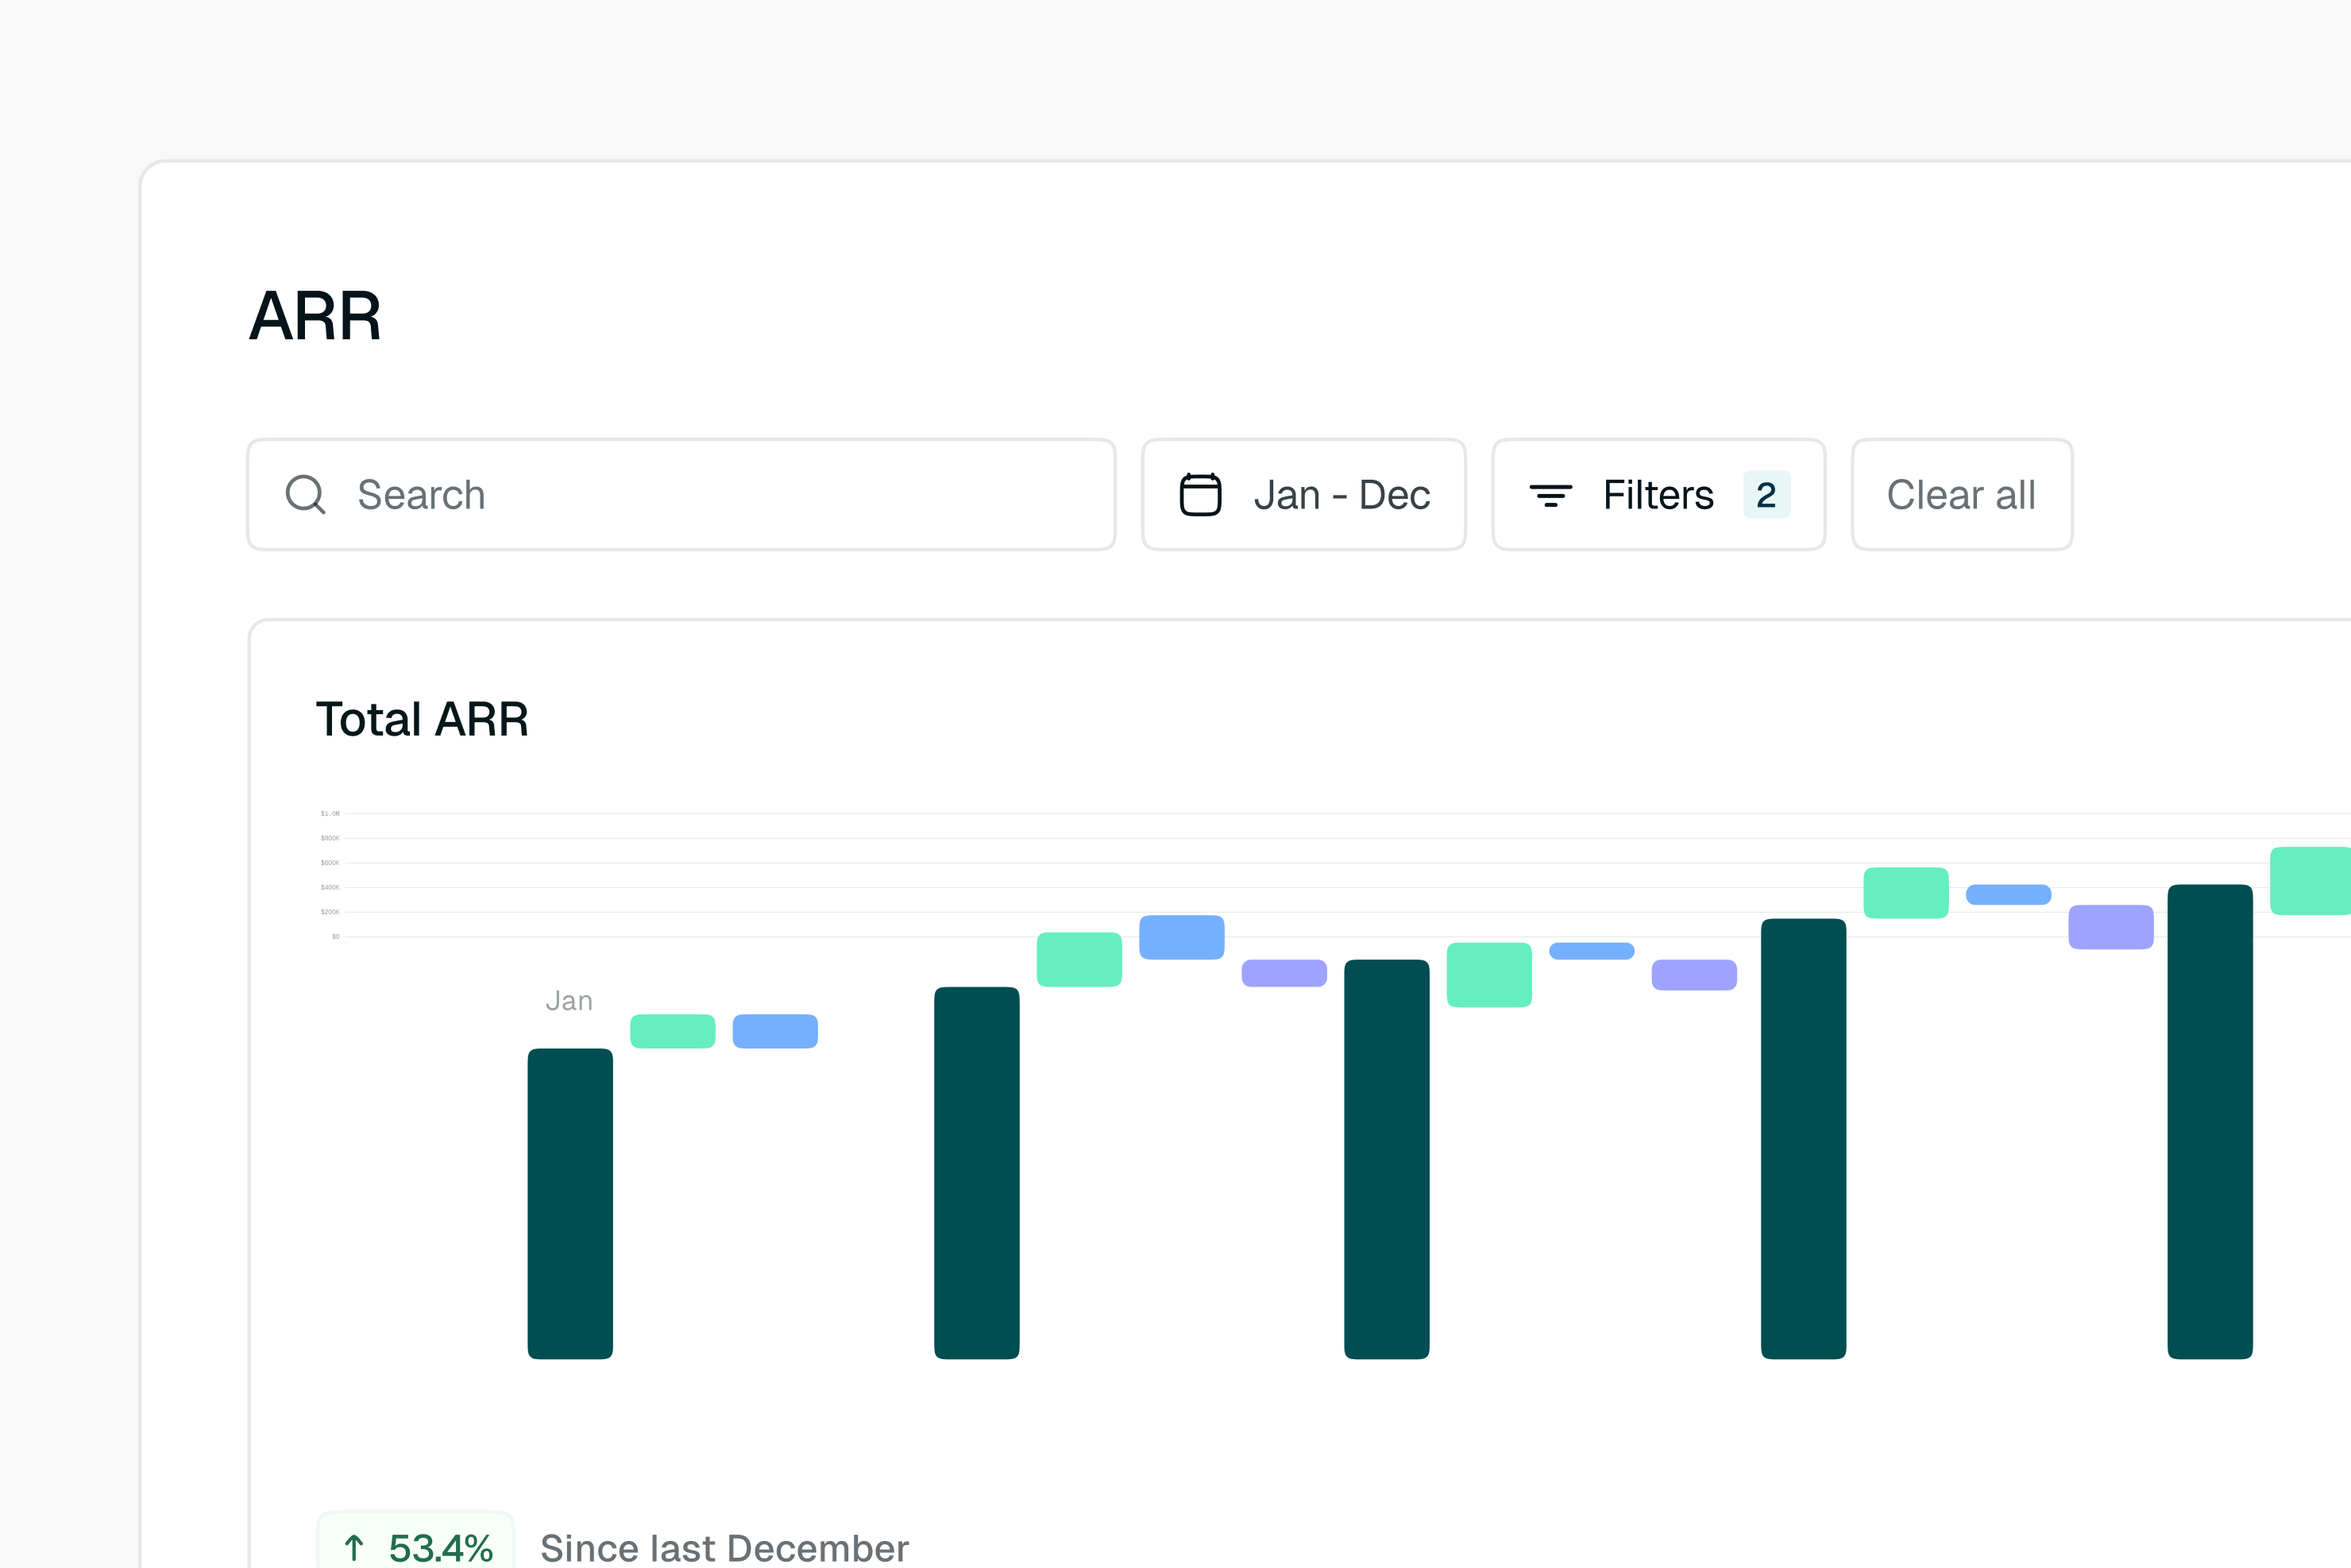
Annual recurring revenue (ARR)
ARR is your MRR × 12 (assuming your recurring revenue is measured on a monthly basis). It's the standard metric for annual planning, board reporting, and company valuation. Investors use ARR to compare companies and assess scale.
There's an important distinction here. Contracted annual recurring revenue includes signed deals that haven't started billing yet. Live ARR refers only to recurring revenue that's active and in effect today (i.e., live contracts contributing to run-rate). Recognized revenue is tracked separately through Revenue Recognition. Finance teams need both views—contracted ARR for forecasting, live ARR for cash planning.
Why it matters: ARR is how the market values your company. Get this number wrong, and you'll mislead investors and yourself.
Average revenue per account (ARPA)
ARPA is your total MRR divided by your number of customers. It tells you how much the average customer contributes to your revenue.
If ARPA trends upward, you're successfully moving upmarket or expanding within accounts. If it trends downward, you might be acquiring smaller customers or facing pricing pressure.
Why it matters: ARPA helps you understand if you're building a business of valuable accounts or just accumulating low-value logos.
Expansion revenue
Expansion revenue is additional revenue from existing customers—upsells, cross-sells, or increased usage. It costs far less to generate than revenue from new customers, making it the most efficient growth lever you have. ChartMogul's analysis found 40% of growth at scaled companies now comes from expansion.
For usage-based models, expansion often happens automatically as customers consume more. But you need systems that can distinguish organic usage growth from formal contract upgrades.
Why it matters: Strong expansion revenue means your product delivers value that grows with your customers.
Customer lifetime value (LTV)
LTV estimates the total gross profit you'll earn from a customer over the full relationship. A common baseline formula is: (monthly ARPA × gross margin) × average customer lifespan (in months).
Accurate LTV depends on realistic churn data. Underestimate churn, and you'll overestimate LTV, potentially justifying reckless spending on acquisition.
Why it matters: LTV sets the ceiling for what you can spend to acquire a customer and still make money.
LTV to CAC ratio
This ratio compares customer lifetime value to customer acquisition cost (CAC). It's the ultimate test of unit economics. If you spend a dollar to acquire a customer, how many dollars do you get back?
A 3:1 ratio is a common benchmark: 3 dollars earned for every dollar spent on acquisition. Below 1:1, you're losing money on every customer. Above 5:1, you might be underinvesting in growth.
Why it matters: This single ratio tells you if your business model is fundamentally viable.
Rule of 40
The Rule of 40 states that your revenue growth rate plus your profit margin should equal or exceed 40%. You can grow fast with low margins, or grow slowly with high margins—but the combination should hit that threshold.
This metric helps boards and investors assess overall business health without forcing a false choice between growth and profitability.
Why it matters: The Rule of 40 is a primary filter for how to evaluate SaaS companies at any stage.
Acquisition efficiency metrics
These metrics measure how effectively you convert sales and marketing spend into new customers. Without them, you can't know if your go-to-market motion is sustainable.
Customer acquisition cost (CAC)
CAC is your total sales and marketing spend divided by the number of new customers acquired. It's the price tag for bringing a new logo in the door.
Track both blended CAC (including organic traffic) and paid CAC (paid channels only) to understand which channels actually work. And be disciplined about what costs you include. If you leave out sales engineer salaries or CRM software, you'll understate your true CAC.
Why it matters: CAC tells you the real cost of growth, not the fantasy version.
CAC payback period
CAC payback is the number of months it takes to earn back your acquisition cost through a customer's gross margin contribution. Shorter payback periods mean faster reinvestment and less cash flow pressure.
For usage-based models, payback can be harder to predict because revenue often ramps over time rather than starting at a fixed amount.
Why it matters: Payback period determines how much capital you need to fund growth.
Magic number
The SaaS magic number formula divides your net new ARR by the previous period's sales and marketing spend. It measures the output of your sales engine relative to the fuel you put in.
A magic number above 1.0 indicates efficient growth. Below 0.7 suggests you're spending too much to acquire revenue. Pouring more money into marketing will just increase your burn.
Why it matters: The magic number tells you whether to step on the gas or pump the brakes.
Make MRR, ARR, and NRR match—book a demo
Retention and expansion metrics
Retention is the economic engine of SaaS. Because acquisition costs are high, profitability depends entirely on keeping customers for a long time. Even small improvements in retention dramatically impact long-term value. In fact, a 5% improvement can drive 25%+ increase in profits.
Customer churn rate
Customer churn is the percentage of customers who cancel during a given period. Calculate it by dividing lost customers by starting customers.
But logo churn can be misleading. Losing 10 customers who pay $100 a month is very different from losing one enterprise customer who pays $10,000.
Why it matters: Churn is the leak in your bucket. Ignore it, and no amount of new business will save you.
Revenue churn rate
Revenue churn measures the percentage of MRR lost from existing customers due to cancellations and downgrades. Unlike logo churn, it accounts for the dollar value of the loss, which includes both cancellations and downgrades.
This gives finance teams a more accurate picture of how attrition affects the top line.
Why it matters: Revenue churn shows the financial impact of attrition, not just the customer count.
Net revenue retention (NRR)
Net revenue retention is the percentage of recurring revenue retained from existing customers, including expansion. The formula: (Starting MRR + Expansion - Contraction - Churn) ÷ Starting MRR.
NRR above 100% means you can grow even without acquiring new customers. It's widely considered the most important metric for assessing long-term SaaS health.
Why it matters: NRR reveals whether your existing customer base compounds growth—or whether expansion is failing to offset churn and contraction.
Gross revenue retention (GRR)
GRR is the percentage of revenue retained excluding expansion. It shows the floor of your retention—how much you'd keep if no one upgraded. GRR can never exceed 100%.
If your NRR is high but GRR is low, you're masking churn with strong upsells. Eventually, that churn catches up.
Why it matters: GRR measures product stickiness without the flattering effect of expansion.
How to operationalize SaaS revenue metrics with AI and automation
Defining metrics is easy. Tracking them accurately is where most finance teams struggle.
The problem is data quality. When contract details are trapped in PDFs, usage data sits in event logs or a data warehouse, and billing happens in a siloed ERP, the numbers often don't match. Finance teams spend weeks reconciling data instead of analyzing it.
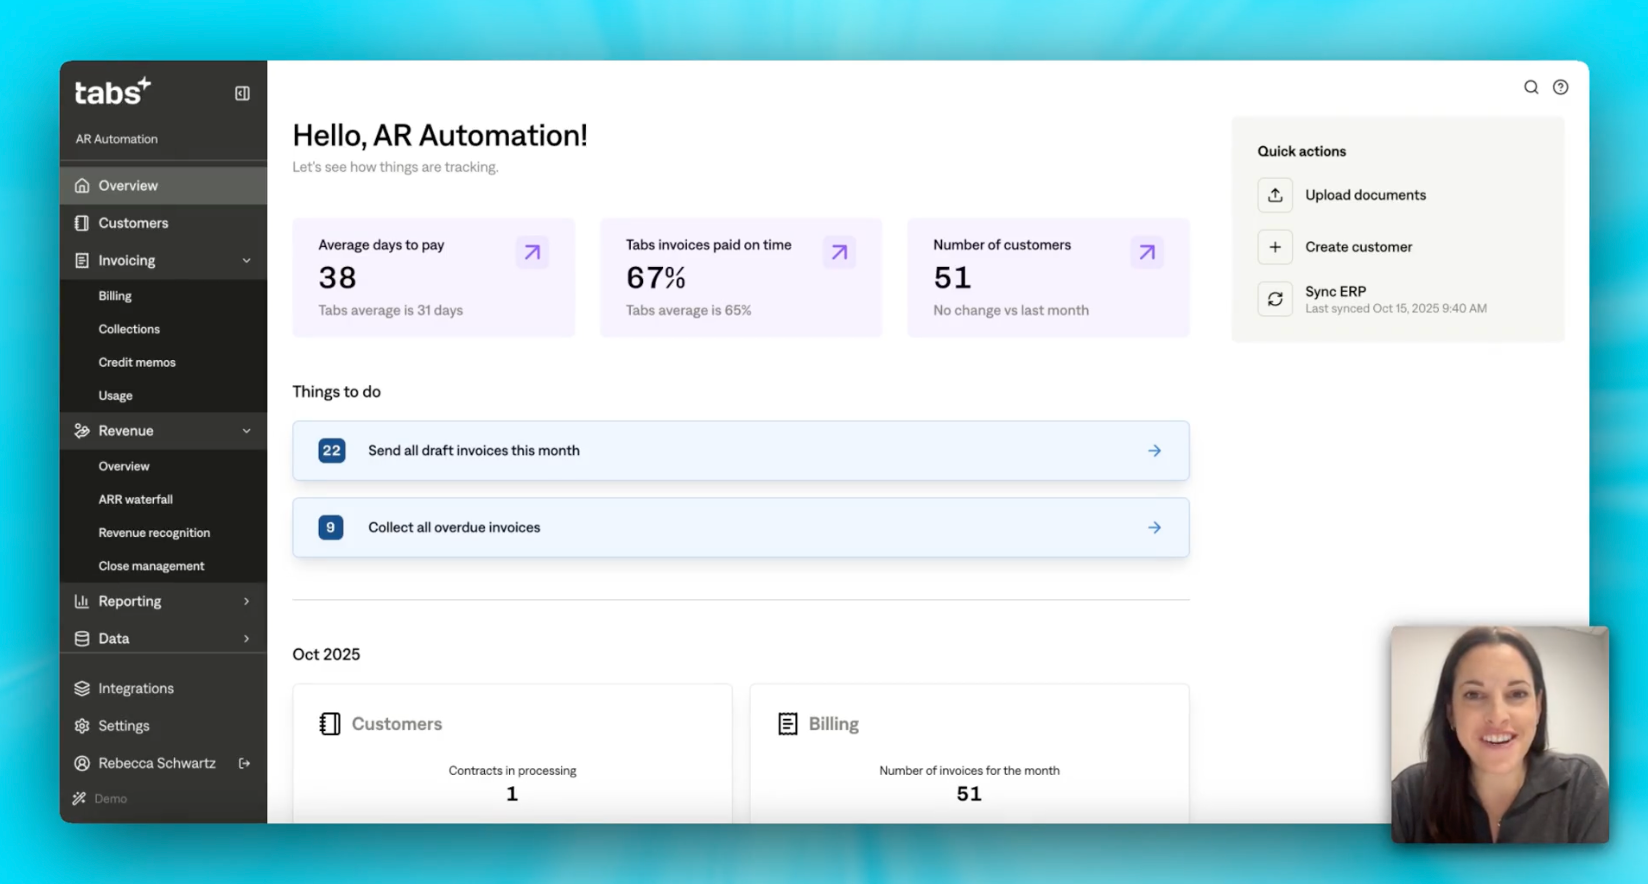
Modern revenue automation platforms like Tabs solve this by treating finance as a system of intelligence, not just a system of record. Tabs sits downstream of CRM and CPQ to operationalize signed contracts, so billing and Revenue Recognition follow what was actually agreed. Tabs uses AI billing agents to automate contract-to-cash workflows downstream of CRM and CPQ, operationalizing signed contracts across invoicing, billing operations, Revenue Recognition, and collections. And unlike generic automation tools, Tabs preserves commercial context from the signed terms.
Tabs uses trained models to extract key terms and classify billing and Revenue Recognition implications (e.g., ramps, true-ups, thresholds, and milestones), then maps those terms into billing workflows and Revenue Recognition schedules.
Automate invoicing from executed contracts
Manual invoice generation is the primary source of errors that corrupt MRR and ARR tracking. Tabs automatically generates invoices directly from executed contracts, aligning what you bill to what was signed and reducing mismatches caused by manual rekeying.
Why it matters: Reduces manual data entry so fewer billing errors cascade into MRR and ARR reporting.
Extract contract terms with AI
Contract terms buried in PDFs create data quality issues downstream. Tabs uses trained models to ingest executed contracts, extract key billing terms, and flag exceptions for review—including pricing escalators, usage thresholds, overage rates, renewal dates, and milestone triggers—so downstream billing workflows reflect the signed commercial logic.
Why it matters: Structured contract data becomes the foundation for accurate forecasting and SaaS reporting.
Recognize revenue with ASC 606 compliance
Revenue recognition errors distort growth metrics and create audit risk. Tabs automates Accounting Standards Codification (ASC) 606-compliant Revenue Recognition based on executed contract terms and billing activity. This extends to subscription, usage-based, and even hybrid models, with configurable review workflows for exceptions.
Why it matters: Your recognized revenue numbers stay audit-ready without spreadsheet gymnastics.
Accelerate collections with smart dunning
Late payments inflate Days Sales Outstanding (DSO) and distort cash metrics. Tabs automates collections workflows with embedded payment links and reminder cadences based on invoice status, due dates, and historical payment behavior. You reduce DSO drift, prevent avoidable delinquency, and keep cash flow reporting clean.
Why it matters: Faster collections mean cleaner cash metrics and fewer write-offs.
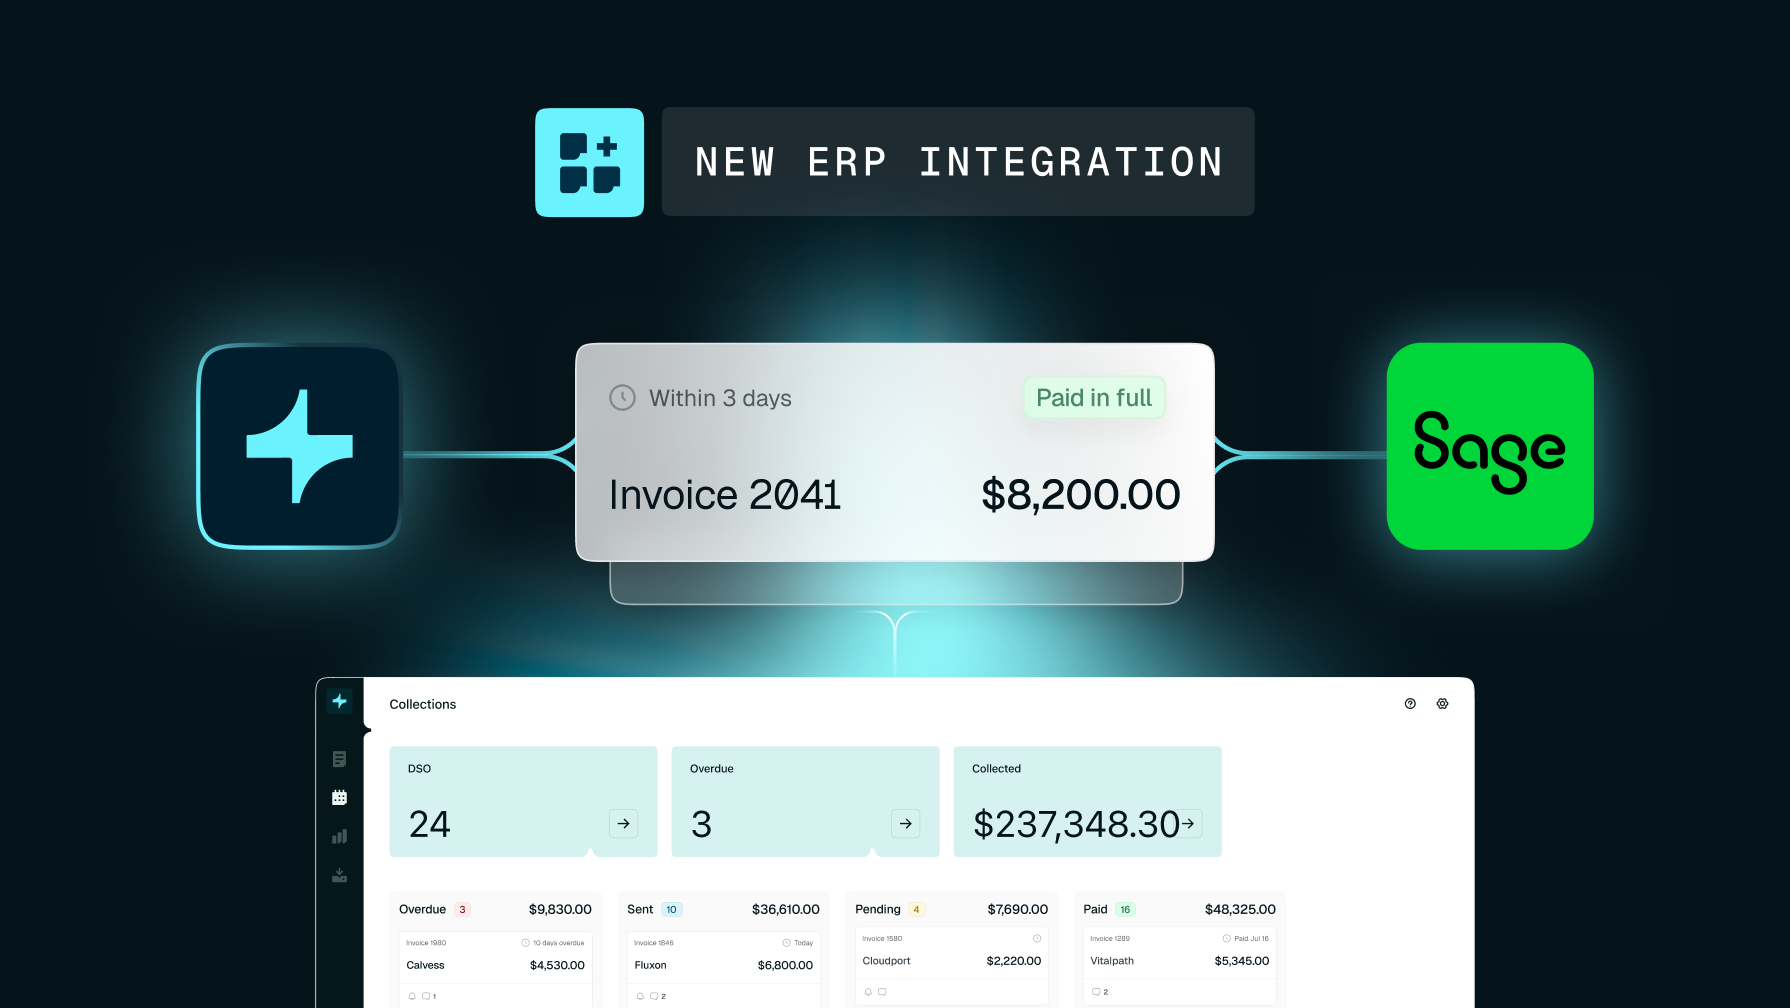
Unify CRM, billing, and ERP into a single revenue record
Disconnected systems create discrepancies—your CRM shows one ARR number, billing shows another, ERP shows a third. Tabs creates a unified contract-to-cash record by linking executed contracts, usage data, invoices, payments, and key terms into a single source of truth for finance.
Why it matters: One number. One source of truth. Far less reconciliation at month-end.
Frequently asked questions
Which SaaS revenue metrics should finance teams automate first?
Start with MRR and ARR, then automate revenue churn (and the inputs to NRR). These foundational SaaS revenue metrics drive almost every other financial insight, and automating them eliminates the reconciliation scramble at month-end.
How do usage-based pricing models change NRR calculations?
Usage-based revenue fluctuates monthly based on consumption, making NRR more volatile. You need real-time usage tracking to calculate it accurately. Revenue Recognition must align to delivered usage rather than straight-line assumptions across billing periods.
What CAC payback period is typical for B2B enterprise sales?
Enterprise sales typically see payback periods of 12–18 months due to higher acquisition costs and longer sales cycles. The key is ensuring payback occurs well within the average customer lifespan.